Data and analytics

Data and analytics built into the product

Cloudnonic builds the data pipelines, analytics and reporting that make a product useful to the people who operate it: field devices streaming into a monitoring platform, product catalogs feeding an optimisation engine, operational dashboards a team opens every morning. We work in Python and PostgreSQL on AWS, inside the product rather than next to it, with the same ownership of correctness and operations as the rest of the platform.

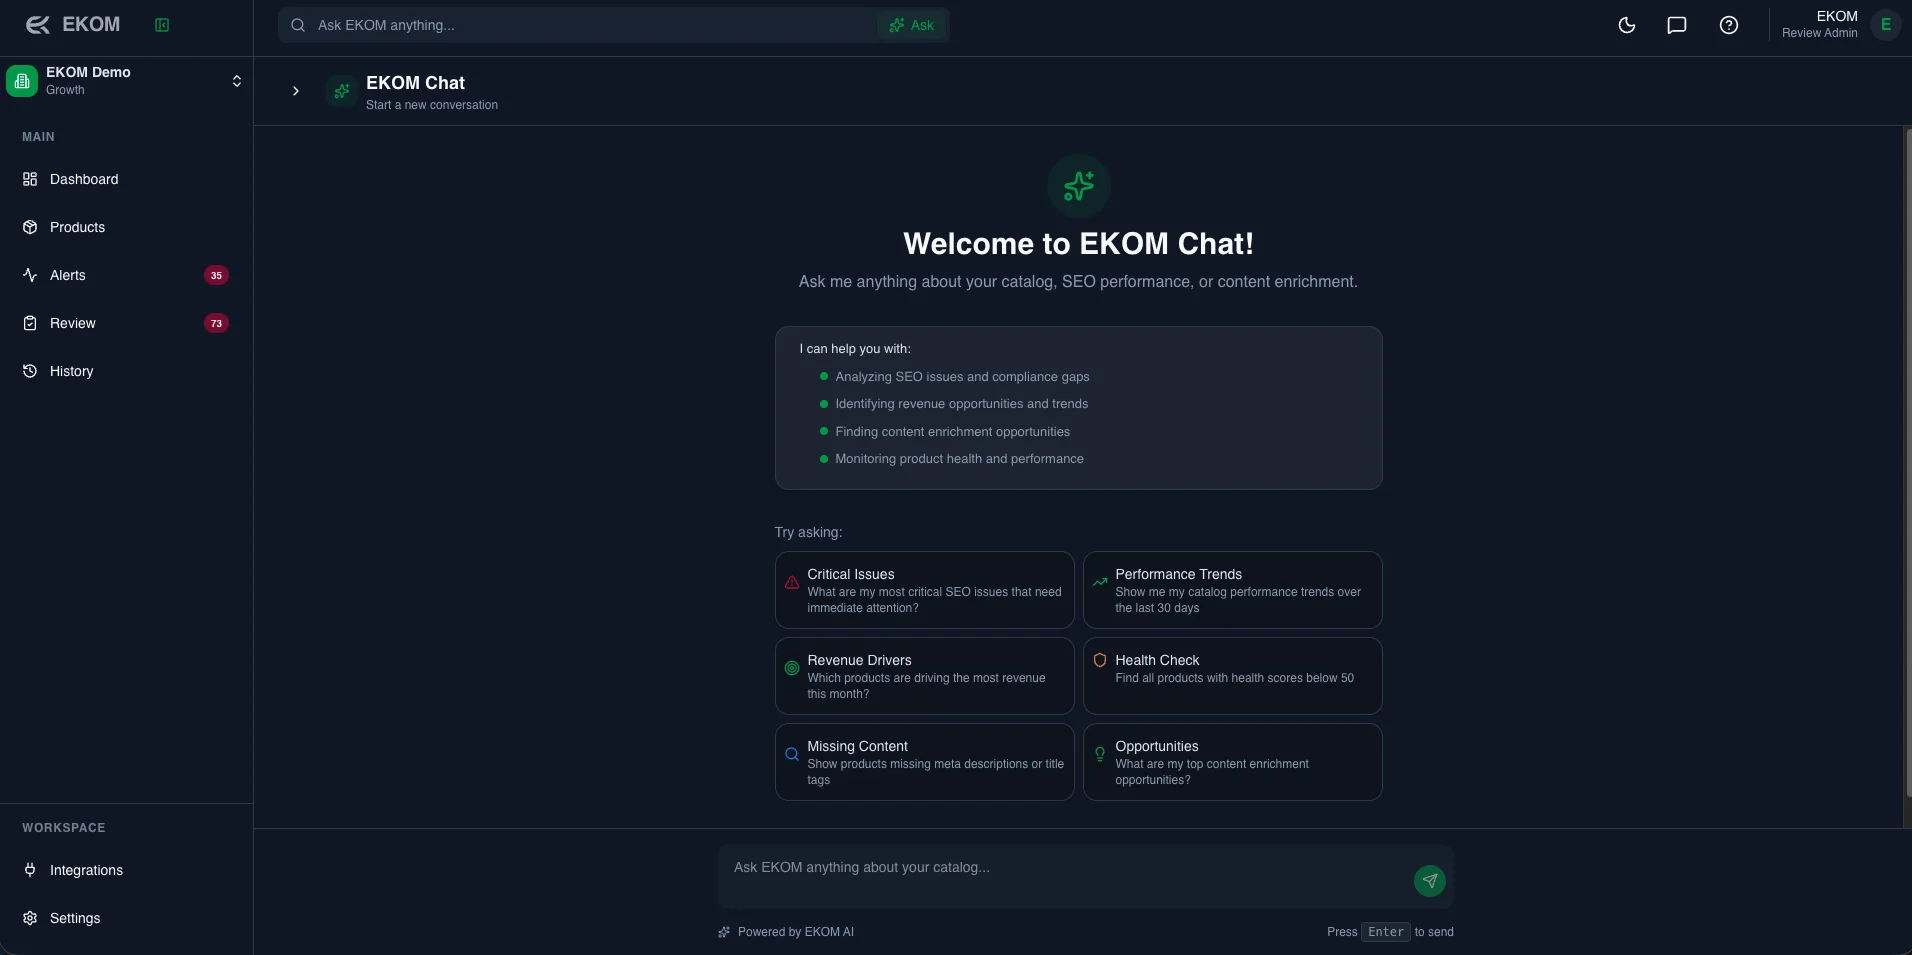
50,000+
Products monitored
EKOM AI
99.9%
Uptime guarantee
EKOM AI
20+
Teams trust the platform
EKOM AI

What is included

Data modelling and ingestion

Schemas for the events and entities that matter, and ingestion from devices, APIs and files that is idempotent, validated and monitored.

Pipelines and processing

Batch and streaming processing in Python on AWS, with lineage and reprocessing, so a bug in a transformation can be fixed and re-run rather than patched.

Analytics and dashboards

Metrics defined once and agreed with the business, served through dashboards built into the product or into the tools your team already uses.

Alerts and operational views

Threshold and anomaly alerts for the operators, with the context they need to act, not just a number that crossed a line.

Data quality and operations

Tests on the data itself, freshness checks, cost monitoring and a named engineer who owns the pipeline in production.

What goes wrong, and what we decide instead

  1. Dashboards before definitions

    Charts are built from whatever the database contains, and two teams read different numbers for the same metric.

    What it costs

    Meetings spent arguing about data instead of deciding, and a board deck nobody trusts.

    How we decide

    Each metric is defined once, with its owner and its source, before a chart is drawn.

  2. Pipelines without reprocessing

    A transformation bug is found weeks later and there is no way to recompute history, so the error is documented instead of fixed.

    What it costs

    Permanently wrong reports and manual corrections for every period.

    How we decide

    Raw data is kept, transformations are versioned and idempotent, and reprocessing a period is a routine operation.

  3. Analytics as a separate project

    A BI vendor builds reports next to the product, with its own copy of the data and nobody owning the gap between them.

    What it costs

    Stale numbers, duplicated costs, and a product that cannot show its own users what is happening.

    How we decide

    Analytics is built into the product by the team that owns the data model, and reporting tools read from the same definitions.

How we work with you

How we work with you

Data work is usually part of a larger platform engagement, because the value is in the product the data feeds. It can also start as a fixed scope: one pipeline and one set of dashboards with an agreed definition of correct, which then grows with the product.

Your product team · What this prevents: A prototype that never becomes a platform, and a CTO hire made before the product deserves one.

The two engagement models →

Stack we use

Chosen per project. We pick what your team can run after us, not what is fashionable.

  • Python
  • PostgreSQL
  • FastAPI
  • AWS Lambda
  • React
  • React
  • AWS Lambda
  • FastAPI
  • PostgreSQL
  • Python

Proof

Case studies in this scope. Every figure comes from the study behind it.

AI-Powered E-commerce Optimization

EKOM AI

Products monitored
50,000+
Uptime guarantee
99.9%
Teams trust the platform
20+
Support available
24/7
  • Python
  • React
  • AWS
  • Python
  • React
  • AWS
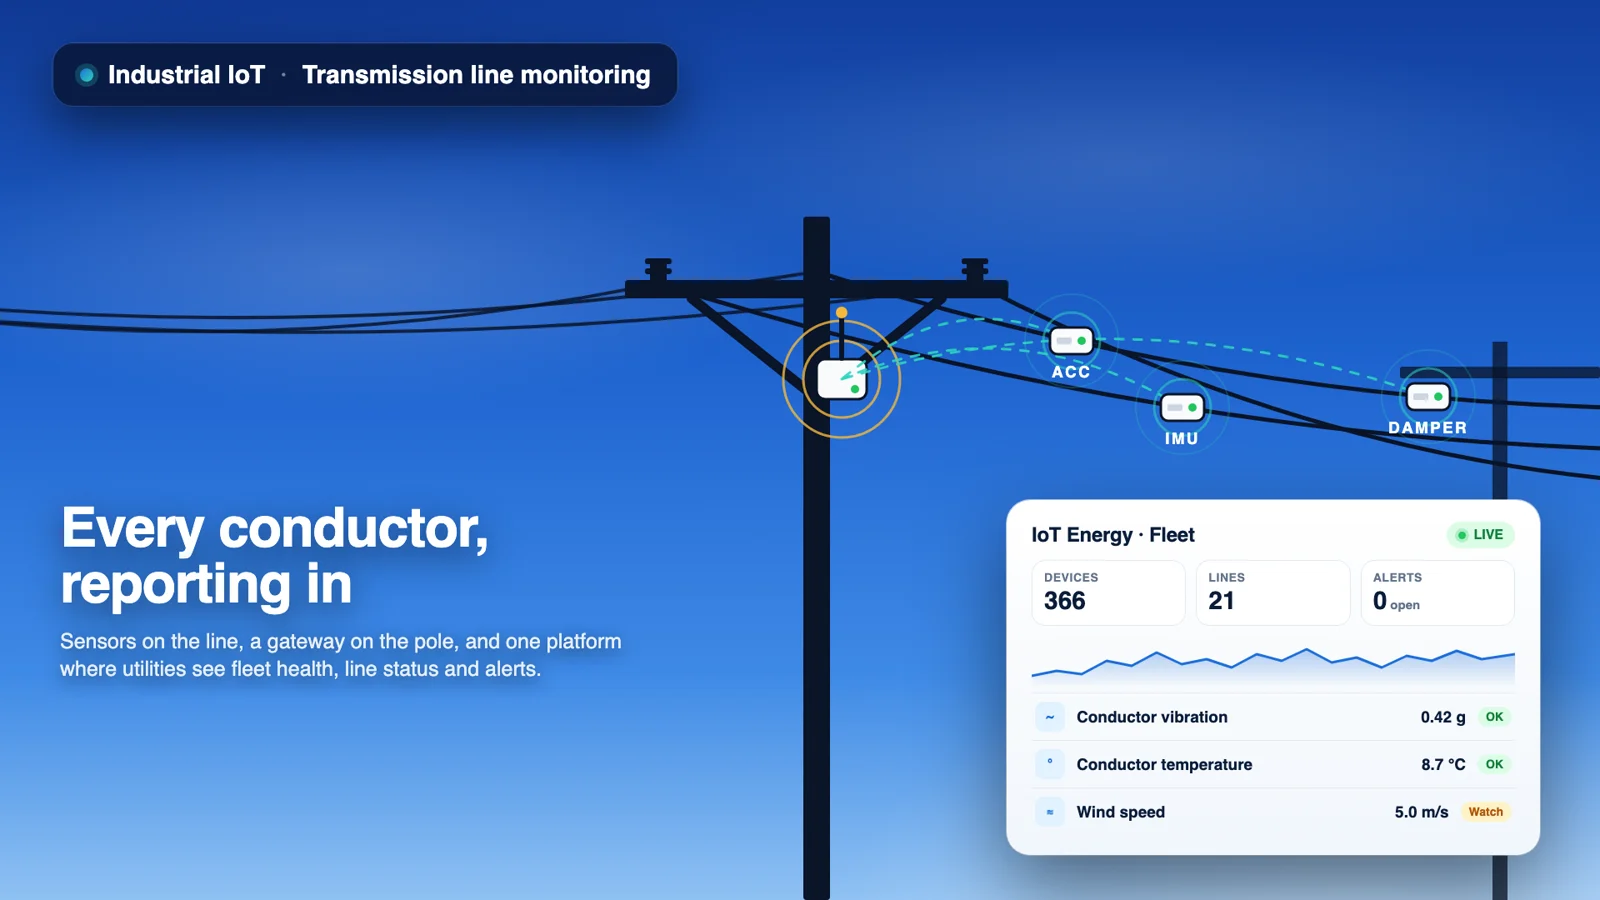
Industrial IoT — grid monitoring platform

IoT Energy

Field devices registered on the platform
366+
Transmission lines monitored
21+
Utilities and partners with their own tenant
13+
Sensor types with their own processing chain
5+
  • FastAPI
  • React
  • PostgreSQL
  • AWS Lambda
  • Terraform

Frequently asked questions

Do you build data warehouses?

When the product needs one. For most of the platforms we run, PostgreSQL with well-designed schemas and Python processing on AWS covers the analytical load. We introduce a warehouse or a streaming layer when the volume or the latency requires it, and we say which numbers justify it.

Can you connect field devices and industrial equipment?

Yes. We have built ingestion for hundreds of field devices across several device types into a single monitoring platform, with per-tenant views for operators and partners. The pattern is the same for any source that streams events.

How do you make sure the numbers are right?

Definitions agreed with the business, tests on the data itself, freshness and volume checks, and reprocessing that lets us recompute a period after a fix. Correctness is monitored like uptime.

Which tools do you use for dashboards?

Dashboards built into the product in React when the users are your customers or operators, and your existing BI tool when the users are internal. Both read from the same metric definitions.

Built the AI-Native way

Every service on this page is delivered with our AI-Native process: specs as the source of truth, agents in the pipeline, and a named engineer signing off at staging.

How we build with AI →

Want to see how this would work for your product?

Book a call and we will go through your architecture, your constraints and what the first ninety days would look like.Book a technical consultation
CLOUDNONICCLOUDNONICCLOUDNONIC